FormWorks tells you how your users interact with your forms. Beyond measuring conversion rate, it measures views and engagement. In this article you will learn how to set up FormWorks, and how to use the data it provides.
Setting Up FormWorks
FormWorks is activated like any other WordPress plugin. On activation, you will be prompted to install the CalderaWP License Manger, if not already installed. You can use the CalderaWP License Manager to activate your license. Once active, you will receive automatic updates to FormWorks.
At this point, you will have a “FormWorks” menu. In the main FormWorks screen you will see a list of all of the forms FormWorks has detected and a brief summary for each.
On first install of FormWorks, you will not have any saved data for FormWorks to analyze. Time travel is not yet a feature of FormWorks. At this point, unless you wish to setup Google Analytics Event Tracking, you should drive some traffic to the pages with your forms before continuing.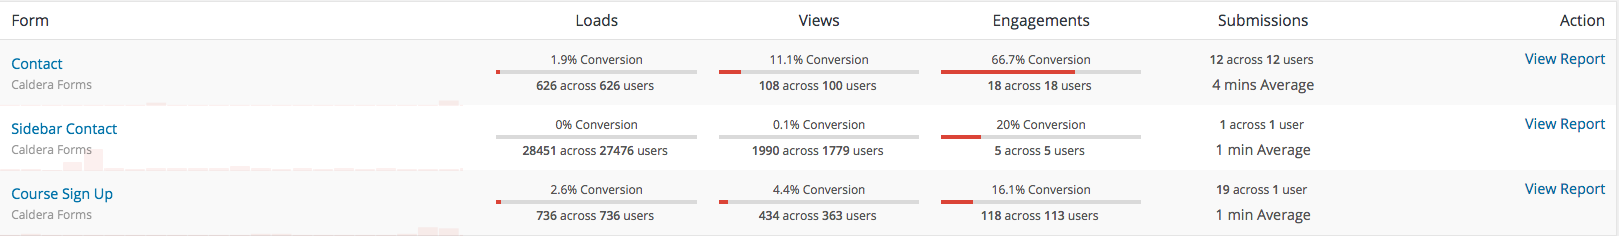
Setting Up Google Analytics Goal Tracking
Google Analytics can be used to track specific actions taken on a site. FormWorks can be used to trigger these events. In the “Goal Tracking” tab of the main FormWorks admin screen there are specific instructions for setting up Goal Tracking with FormWorks.
Note that if you have already setup Google Analytics on your site, saving your Analytics ID in FormWorks is not needed. If you have not set up Google Analytics globally, you probably should, as FormWorks is not a substitute for Google Analytics on your site since FormWorks analyzes your forms only, not your whole site’s performance and traffic.
Using The FormWorks Data
Once FormWorks has collected data on a form, you can click the “View Report” link for the form to view detailed data.
At the top of the page is a filter for date range and device type. By default, the range will be the current week, and all device types will be displayed. You can filter by a custom or preset date range, and can optionally limit the data to any combination of mobile, tablets and desktop devices.
Be sure to click the “Apply Filters” button to update what stats are shown.
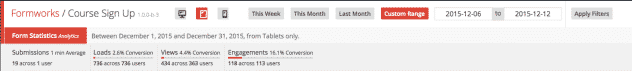
Once you have selected a range, the mini-summary graphs and the main graph will be updated. This data is broken down by loads, views and engagements. The mini-summary graphs show you a conversion rate for each of these three metrics, and the main graph shows the total for each and total conversion rate.
A “load” is recorded when the form is loaded on a page. A “view” is recorded when a form is loaded on the page and is in a visible part of the screen. An “engagement” is recorded when any form field is focused. A conversion is recorded when the form is submitted.
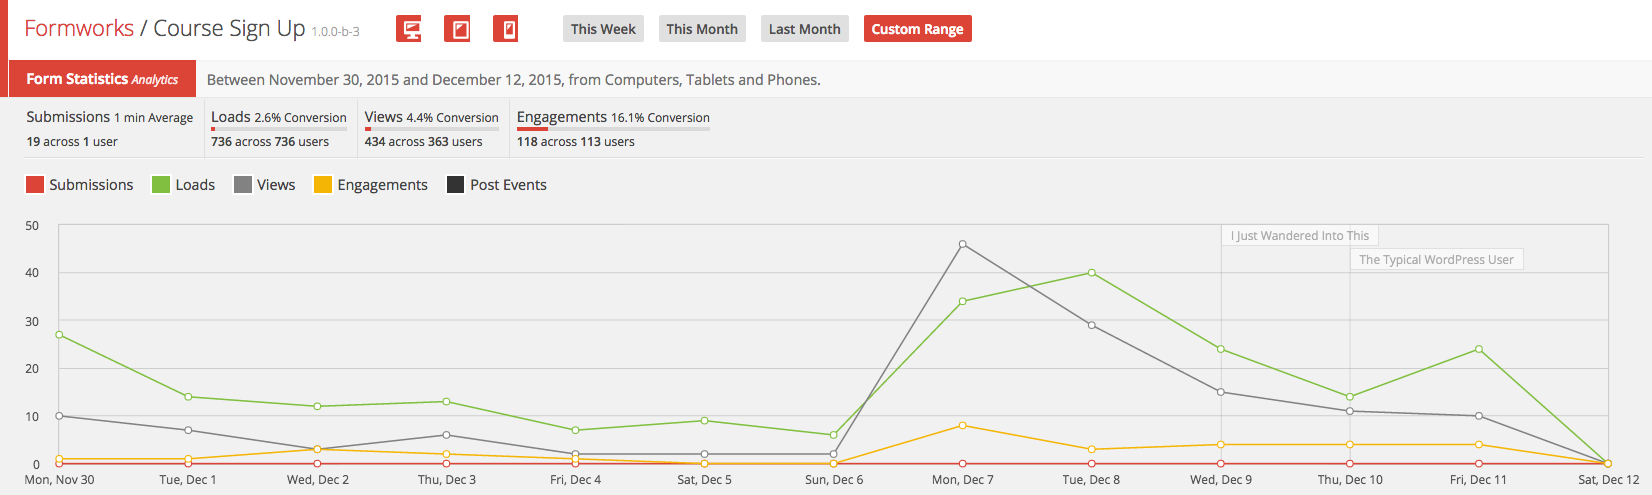
The main graph can be used to display all metrics, and to show which posts were published during the current date range. Each metric on the graph can be hidden by clicking the box in the key for each metric.
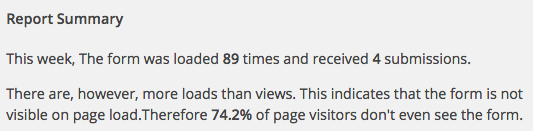
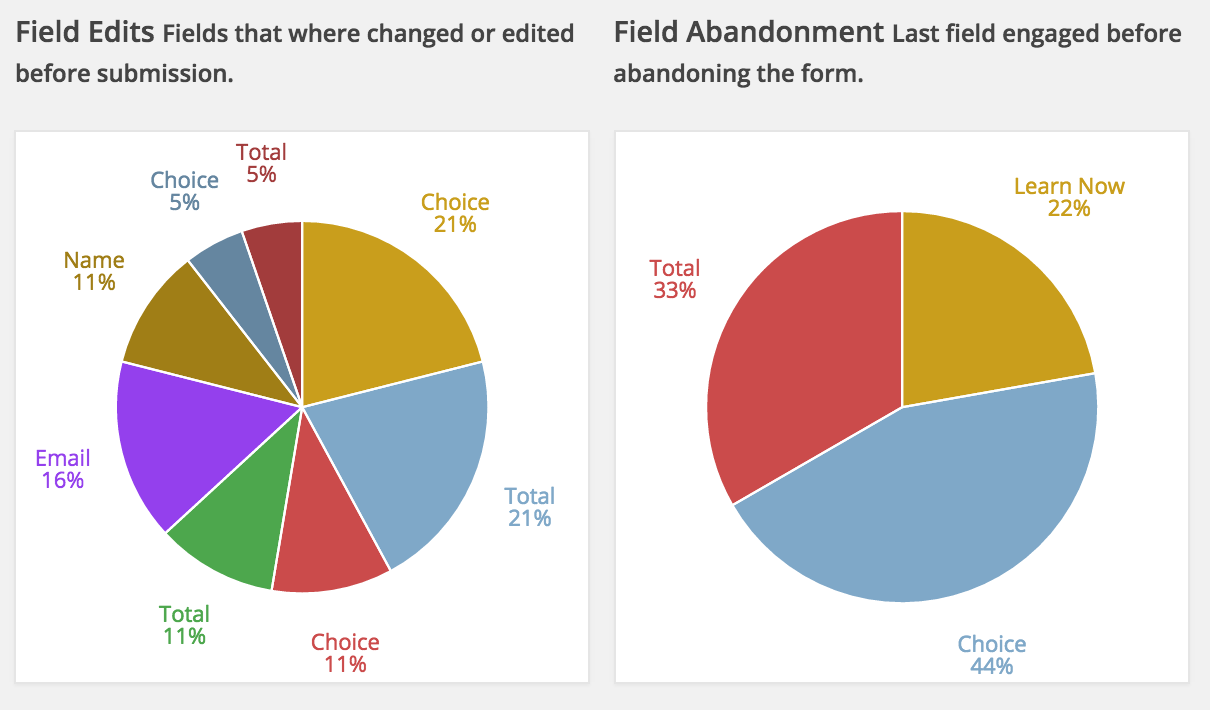
Underneath the main graph you will see two sections. One with a text summary of the data and another providing information on the fields your site’s visitors engaged with. The summary provides a brief overview and if possible will indicate potential problems, such as your form not being visible on most page loads.
Next to the summary are two pie charts. The first will show which fields were actually edited by users. The second shows the last field that a visitor engaged with before abandoning your form.