If you want to make informed, data-driven decision, analytics data from your website alone can’t help you. You need data that answers the questions that reveal the most strategic path forward for your business. Sounds good, but having the right question, the data to answer it and the user interface to do it is not always easy.
EZ Data was built to analyze your WordPress data, so you can make more informed decisions for your business. You create a group, send data associated to that group, and EZ Data analyzes that data, as simply as possible.
They have a great article about the importance of business data analysis, however what about a very simple example of data analysis using Caldera Forms?
Polls
Polls, whether it is a silly fun poll created by your favorite buzz website, or a poll for to help us understand how the world is feeling, are all created to help analyze data.
Caldera Forms is one of the best form builder WordPress plugins, so let’s use it as an example, conveniently EZ Data is already integrated with Caldera Forms.
EZ Data WordPress Plugin
 If you want to do this on your website, you will need to add the EZ Data WordPress plugin to your website, which will give you the Caldera Forms integration.
Before we move into Caldera Forms, after installing the plugin you will need to log into your EZ Data Dashboard and copy your JWT Token. Once you have the plugin installed you will see the EZ Data Admin menu and where to put in the token.
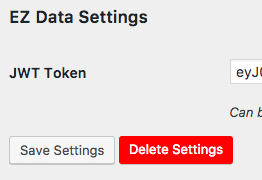 You will also need to create a new group to send the data to and analyze. You can do so from the data dashboard.
Create the Form
We are going to use a real use case, on the plugin integration page of EZ Data there is a form that asks people for suggestions on what plugin they want EZ Data to integrate with next. The form is simple, it only has 2 fields, but that is all I needed.
For your form you will need at least 1 field that you want to poll and it can be any type of field. The form on the plugin suggestion page uses 2 input fields as to not limit any plugins. Although if you have a subset of answers you want to poll on, a select or radio button would also work.
Form Processor
Caldera Forms has a built-in functionality called form processors. Processors add types of functionality that allows a form to “process” something after a user submits a form.
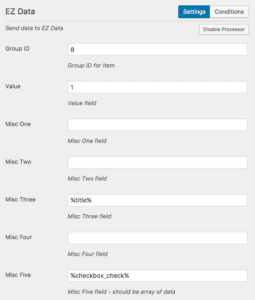 EZ Data integration gives you a new type of processor, which we will need to set up.
Setting up the form processor is easy, it does require some use of magic tags. In the above screenshot for we are sending the data to group with ID 8.
To find the id, go back to your data dashboard and click on groups, the second column in data you see will be the ID of the group.
Under value you are going to put “1” because each entry in your poll is valued as 1 entry. Lastly we are going to use a magic field to put in misc three. We use misc three because misc one and misc two are both integer or number value only. Misc three and misc four are both strings (text) fields.
If you are not sure how magic fields work, they use a syntax of of the slug of the field surrounded by percent signs. In our case the field slug was plugin_suggestion so the magic field is %plugin_suggestion%. When the form is filled out and submitted, the magic field will automatically be the value of the user input into the text field.
Verifying it Works
The next time may be to try it out a few times and make sure it works. To verify it works, got to your EZ Data dashboard and click into the group you created. At the bottom of the page you should see the entries populate in a data table.
You can right click and delete test items so they do not affect your analysis.
Data Analysis – Analyzing your poll
The final step now that you have the form running, is to analyze the data. Don’t worry, analyzing of data is ongoing, so you can setup the graph, and check back periodically to see new entries come in.
Graphs – Pie Chart
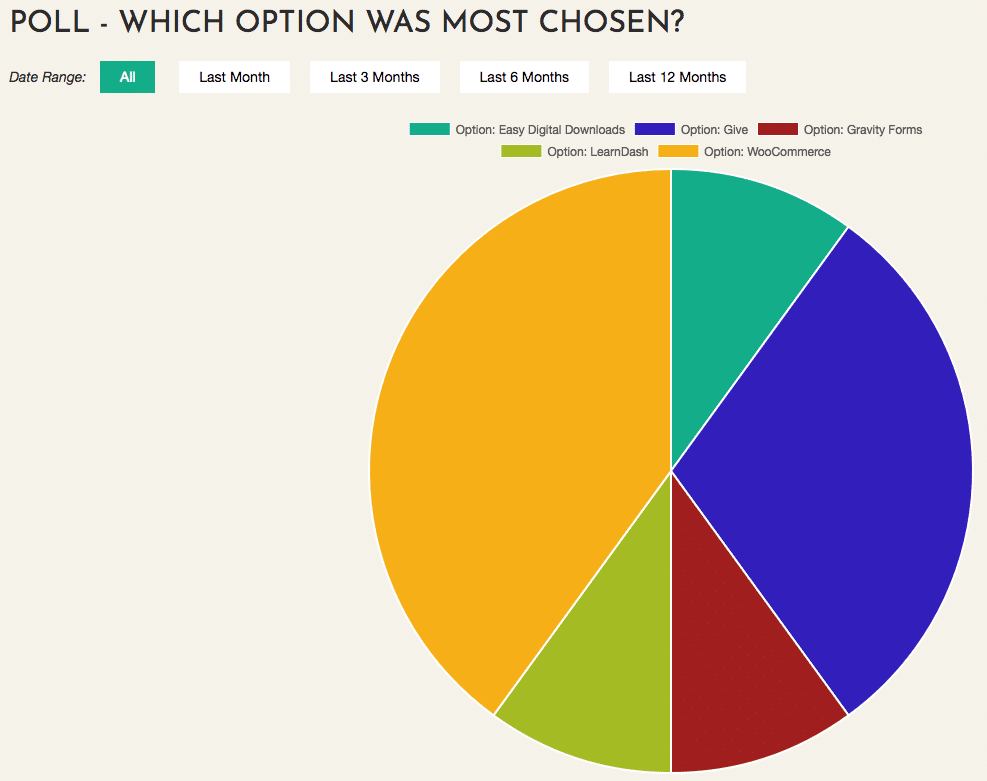
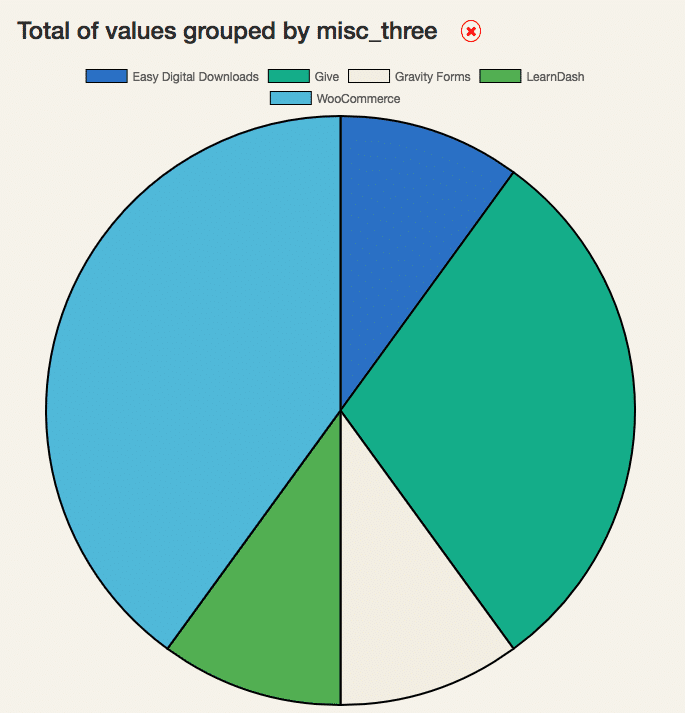
We are going to create a pie chart to showcase the answers to your poll so you can quickly see which answer had the most entries.
We will start by going to “Graphs” in the EZ Data dashboard and clicking the plus to add a new graph, and choose the group that you created.
Next it asks you to fill out a few things based on a sentence. You want the sentence to read:
Total of VALUE grouped by MISC THREE displayed as a PIE CHART
In the simplest way of analyzing, we are taking the sum of the value (1 per entry), and grouping it by the plugin suggestion (or your field). This calculates by adding in all the similar misc four items.
Click “Save Graph” and your new graph will appear below
Viewing your data
Now that you have your graph created, go ahead and click into it. If you have no data in yet, you won’t see anything, however as data comes in the pie chart will start to fill up.
Ask Your Data Questions
EZ Data’s most recent way to easily analyze data is called “Questions”. Basically Questions are setup to be an easy way to “ask” something about your data and have EZ Data analyze and answer it for you with a bar graph or pie chart.
You would do everything with Caldera Forms like you did before, but when you log into EZ Data, that is where things (hopefully) get easier.
Start by creating a question, to create a question click on “Questions” in the left menu and click the plus sign.
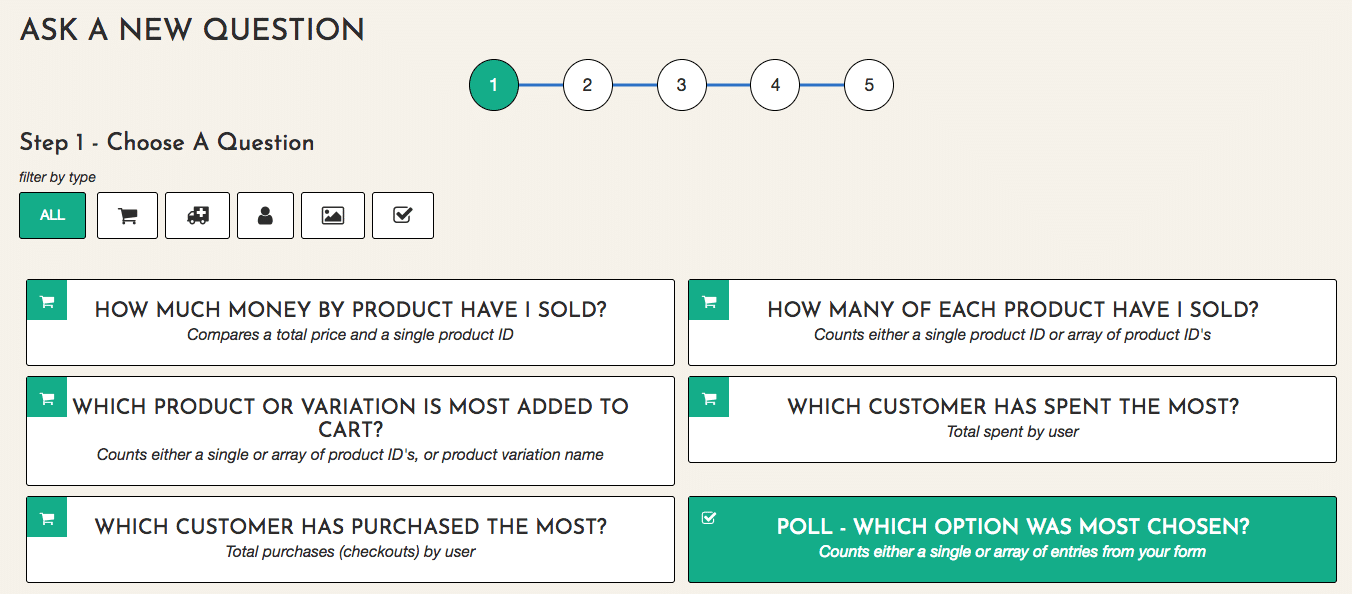
Select “Poll – Which option was most chosen?”, if you have a hard time finding it, filter the view by clicking the checkbox icon to filter only form related questions.
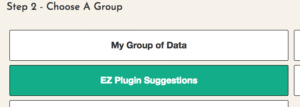
Next you will select which group, field within that group, and how you want the answer displayed (bar graph, or pie chart).
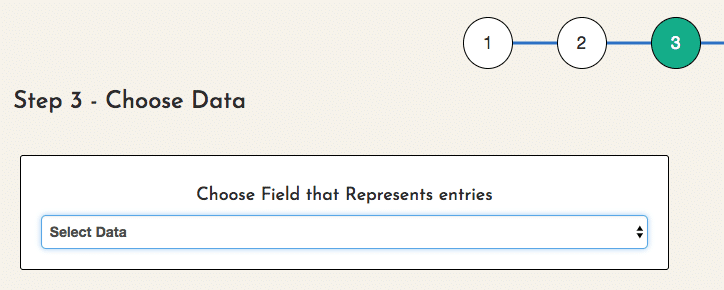

Finally you will go back to all questions and see your question, click into to see your answer displayed!
Note at the time of writing this, the Question method to analyze form data supports arrays like checkboxes (misc_five) data vs. the data analysis does not.
Polls Are Just the Beginning
Now that you have a rough idea of what you can do with EZ Data, start clicking around your website. See or do anything you wondered how your visitors reacted to? Do they click the same buttons you do?
Tracking and analyzing data from your visitors can help you make more informed business decisions which in turn can increase your profits, whether it be by increasing sales or decreasing costs.
How will you use EZData next?


One thought on “Learning From Polls & Quizzes Created With Caldera Forms & EZData”