What Is Google Analytics?
Google Analytics is a web analytics tool that every serious website owner should have. It allows you to track a vast range of data concerning your site performance, traffic, and even user behavior. It’s a free tool that has the power to totally transform your online marketing strategy. You only need a Google account to get you started.
“Google Analytics is a freemium web analytics service offered by Google that tracks and reports website traffic, currently as a platform inside the Google Marketing Platform brand (1). Google launched the service in November 2005 after acquiring Urchin (2).”
In this Google Analytics Guide, we are going to look at the basics of how this useful tool works, how to navigate its interface, and explore ways of understanding some of the core analytics reports involved.
What Exactly Does Google Analytics Do?
This is an amazing tool that has many functions, but basically, it gives you a quick and easy way of finding out all the vital metrics regarding your website, such as how many visitors you received over a certain period of time, how many of those people were unique visitors, and even their geographical distribution.
The manner in which Google Analytics provides these metrics is mostly automated, which is great news for busy website owners who have a thousand other website tasks to do and don’t have much time to dedicate to collecting data. There is actually so much that this tool has to offer that your only real limitation, when it comes to important website metrics, is your imagination. Other things you can find out using Google Analytics include:
- Your social media metrics (for example, from which social network is all this traffic coming from)
- Whether or not your site is easy to navigate on mobile devices
- Which other sites are linking to yours and how much traffic you’re getting from them
- The amount of traffic you’re generating from other sites compared to search engine queries
- Google Analytics can help you gauge the effectiveness of your digital marketing strategy by showing you a breakdown of where your traffic comes from so you can identify the key targets for your marketing activities
- You can even find out where your visitors go after they leave your site
- The tool also helps you determine your conversion rates (the percentage of visitors who become paying customers)
- You could even apply such metrics to help you identify the number of visitors who sign up for your email list
- It can also help you to streamline your website’s design and coding to improve load times.
And we’ve barely even scratched the surface of what Google Analytics can do…
Why You Need To Use Google Analytics
A firm understanding of the Customer Value Journey is vital to any successful marketing campaign. The customer journey is basically the process which a customer goes through from their first interaction with your brand until their last. It involves the following stages:
- Acquisition: This involves building brand awareness among interested users
- Behaviors: This includes boosting engagement to get people to interact with your business
- Conversion: This stage involves converting those prospects into actual paying customers.
This makes up the core of marketing funnels, and tracking and measuring these metrics is vital. Google Analytics allows you to easily capture all the data so you are able to see which of your marketing efforts are working and which aren’t. When you have such easily accessible digital analytics, you can now make better-informed business decisions.
The information captured by Google Analytics is conveniently made available in different reports that you can find within the user interface. You can then analyze these reports to better understand your customers as they enter your marketing funnel and move along the customer journey. This will ultimately help you make the best strategic decisions for your business.
How Google Analytics Work
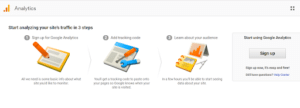
The first thing you need to do is to sign up for an account with Google Analytics. Once that is done, you have to set up your website the right way (the details of which we are going to cover a little later on). The next step is to install a JavaScript tracking code to each page on your site. This simple code will collect anonymous data relating to how users interact with the pages on your site.
This data is then curated and delivered to you in relevant reports based on certain pre-existing criteria. For instance, how a user got to your site (via a desktop device or mobile). But, there are ways of configuring the settings to customize your data. You can use it to segregate or exclude data, for instance, if you’re only interested in seeing visitors’ behavior getting to your site from a specific region. If that is the case, then you could apply a simple filter to exclude all traffic data from those regions which your business does not need to reach.
Setting Up Your Google Analytics Account
To set up your Google Analytics account, you first have to go to http://accounts.google.com and create a Google account (or you could use one that you already have). Use that to set up your Google Analytics account at google.com/analytics and click Start For Free. You will be asked to input some basic information for your site, after which you can start configuring your settings for data sharing. When you’re done with this, simply click on the button labeled ‘Get Tracking ID’. This will give you the simple JavaScript code that you must then install on each page of your site that you intend to track.
How To Add The Tracking Code To Your Site
If you have a WordPress site, you can easily install the tracking code to all your site pages that you want to track through the use of plugins like MonsterInsights. They make the process very simple and easy for everyone, no matter how tech-challenged. But for other sites that are built using HTML, you have to add the code before the tags on the pages that you want to track. Once that is done, it’s time to start learning about your audience.
Understanding Your Google Analytics Account
It’s vital to understand your Google Analytics account in order to be able to not only track the data you want but also to be able to make sense of it so you can use it to improve your marketing efforts. Your GA account is organized in a hierarchy where each account has the potential of having multiple properties. Each of those properties can also have multiple views. This means that you have the potential to manage data effectively where it’s required.
Here is a summary of the levels within this hierarchy:
- Accounts – These allow you to manage and organize how data is gathered from various websites and this is also where you set user permission levels.
- Properties – Every account has at least one property which uses a unique tracking ID that can be found inside the piece of JavaScript website tracking code. You can have multiple properties on one account, which is convenient if you wish to collect data from, say, a mobile app in addition to your website.
- Views – Your Google Analytics account can have multiple views. These determine how your data is represented. You can configure these using specific filters inside the Views tab. This is the level where you can set your goals to capture information on performance such as leads and other KPIs (key performance indicators) regarding your overall digital marketing activities.
How To Use Google Analytics
In a case where you manage multiple accounts, properties, and views, it’s easy to navigate through all those elements from either the Google Analytics homepage or from inside the account interface. Read on to find out what kind of information your GA reports are going to provide you with, as well as how to make sense of those metrics so that you can turn them into actionable intel to help you make better business decisions.
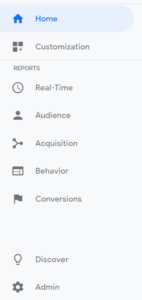
You’ll find 4 main tabs on your Google Analytics account dashboard:
- Home
- Reporting
- Customization
- Admin
1. The Home Tab
This is where you’ll get a quick overview of your GA account. If you have more than one site this is where you’ll see a list of them, and you’ll be able to easily choose which one you want to see the reports for. This tab displays important information relating to your sessions, bounce rates, goal conversion rates, etc. for each of the websites that you have.
- ‘Sessions‘ refer to the various interactions that occur on your site within a specific timeframe.
- The ‘Bounce Rate‘ tab shows you the percentage of visitors who left your site after visiting only one page.
- The ‘Goal Conversion Rate‘ is your site’s overall conversion rate.
2. The Reporting Tab
The Reporting tab in your analytics account shows you important reports that provide you with deeper insights into how well your site is performing and where you can make improvements. When you click on the Reporting tab, you’re taken to a separate page for the Audience Overview Report where you will see the following tabs:
- Dashboards – Shows you an overview of most important reports and is easily customizable by adding any number of widgets you want.
- Shortcuts – Gives you quick access to the most-used reports, which is great for saving you time.
- Intelligence Events – Google Analytics has a Content Experiments tool which lets you test page elements like design, content, online forms, etc. then shows you variations in your site traffic.
- Real-time Reports – Provide useful information about the number of active viewers, as well as the most active pages, or the top keywords being searched all in real time.
- Audience Reports – These provide you with data concerning your site visitors. You can see the number of sessions on your site over a certain period of time, as well as their country, city, language, and even the browser or operating system that they are using.
- Acquisition Reports – These show you the means by which your site visitors got to your site (whether the traffic was direct, organic, referral, or from social media).
- Behavior Reports – With these, you’ll be able to see the different ways your visitors interact with your site. This helps you in determining which of your content is performing well.
- Conversions Reports – These show you the actions taken by your site visitors prior to converting in addition to the total number of conversions that have occurred on your website.
3. The Customization Tab
This tab allows you to create and track customized reports depending on your specific needs. It lets you create as many such reports as you want, all of which are easily accessible via the Customization tab. To create a custom report, all you have to do is choose the metric that you want to track, as well as one or more dimensions. For example, you could choose to track metrics such as bounce rate or page views, and dimensions like operating systems or countries.
4. The Admin Tab
This is where you manage your account, and also where you can switch to other accounts if you have multiple accounts. This is also where you can choose which site you want to view reports if you happen to have more than one website. Here you can also set your goals and link to your AdSense and AdWords accounts to measure your campaigns’ performances. In addition to the accounts and property management and settings, the admin tab is also where you create user segments, specify attribution models, set up alerts and scheduled emails.
Find Out Where Your Traffic Is Coming From
As a growing business, you undoubtedly advertise anywhere you can. Many businesses use guest-posting on blogs, paid online advertisements, Twitter, Facebook, and some other platforms. Sticking your hand into as many pots as possible when it comes to advertisement is a good business practice.
Now, let’s say that in four different social media marketing campaigns you posted a hundred times this week on 15 different platforms — you’ve been busy. You take a look at your website’s Google Analytics, and your page has surged in popularity! You went from 2000 views a day to 20,000 views a day! Wow, amazing! A congratulations is in order.
The only problem is this: you don’t know which of your strategies is the one that’s bringing in all the activity! When you’re advertising on 15 different platforms, the truth of the matter is that usually only one or two of those platforms are really bringing in a lot of traffic. On the other hand, a lot of them are probably bringing you in less traffic than you deserve.
If you want to be efficient, you need to know where your traffic is coming from.
What is UTM?
Glad you asked — UTM stands for “Urchin Tracking Module”, and it is essentially a snippet of code added to the end of a URL that tells Google Analytics where traffic is coming from and why. It is a simple, custom code that is easily generated.
Simply put, UTM parameters tell Google three (or sometimes more) things:
- Where is the activity coming from?
- How is it getting here?
- Why?
When you add custom UTM parameters to your links that you post on specific platforms, you can check Google Analytics, and it will tell you things like this:
- How many people followed the link you posted to Facebook.
- How many people followed the link you posted to Twitter.
- Which advertising campaign the link was associated with.
- Did they click on a blog post or some other type of content?
How Do I Set Up UTM?
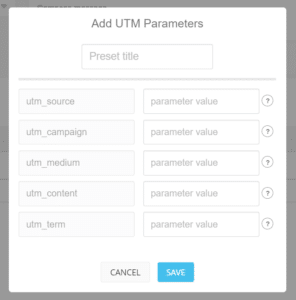
If you use Social Web Suite for scheduling and sharing posts this will be easy for you. All you have to do is click the settings button to add custom UTM parameters. It will open a list of all the previous parameters that you set up; if you haven’t set any up yet, there is a button at the bottom that says “ADD NEW”.
When the next box opens, it will ask you for at least three inputs:
- Utm_source
- Utm_campaign
- Utm_medium
These three inputs you should always use and are what Google uses to give you effective feedback. The “source” is the place you placed the link. This is probably something like Facebook or Twitter. The “campaign” is the name of your social media marketing campaign. It could be something like “August campaign” or “20% off campaign”. The “medium” is what you shared. Was it a blog post, a picture, some other type of content?
You can also use Utm_term (Identify paid search keywords. If you’re manually tagging paid keyword campaigns, you should also use utm_term to specify the keyword.) and Utm_content (Used to differentiate similar content or links within the same ad. For example, if you have two call-to-action links within the same email message, you can use utm_content and set different values for each so you can tell which version is more effective.)
Once you fill out these three inputs, you can add this UTM parameter to any URL you want to post. It will look something like https://www.socialwebsuite.com/?utm_source=facebook&utm_medium=post&utm_campaign=august-campaign
Be careful, though; the URL will now be very long. It’s best to use Bit.ly to shorten your link.
Alternatively, you can create UTM’s with Google URL Builder.
Start Measuring Your Site Performance
Google Analytics is a great tool that helps you measure your site traffic and provides you with the proper information that you can use to improve and maximize your site’s performance. If you haven’t been doing so already, it’s time to start using Google Analytics to enhance your digital marketing plans and get the most out of your actions.


One thought on “All You Need To Know About Google Analytics: A Guide For Complete Beginners”