We all agree that good websites are fast. We hear it from the visitors to our sites, we hear it from search engines. However, WordPress has a certain reputation as sluggish, which may be caused by the infamous “too many plugins installed” problem. But you can’t be sure until you have all of the information. In this post, I’ll show you how to find out what the source of a WordPress performance issue is, so you can fix it.
Part of the issue is that attention to performance often happens at the end of the project. When decisions already led to performance sacrifices that are hard to recover from.
For good results, performance needs to be a constant factor when making a site.
What Is Performance Profiling?
Profiling is gathering information about how fast site works and resources it consumes. Profiling requires a tool that records, interprets, and displays such information.
PHP language has a long history of capable profiler tools with deep insight. Current leaders being open source Xdebug library and commercial Blackfire service. They capture very precise information down to every single function call.
But those can be daunting to install and use. They need changes to PHP configuration and some skills to work with results. That especially prevents their use on shared hosting.
So it is common for PHP frameworks and CMSes to also offer their own, lighter, profiler tools.
How Are Light Profiler Tools Different?
A typical light profiler targets a specific product. It is often made by the product’s original developers.
Light profiler cannot offer as thorough and precise information. On the other hand, it is more apt to provide information that is specific to the product.
WordPress does not have an official profiler tool. But, you guessed, there are plugins for that!
In this post, I will cover two of them — Query Monitor from John Blackbourn and Laps of my own.
Query Monitor
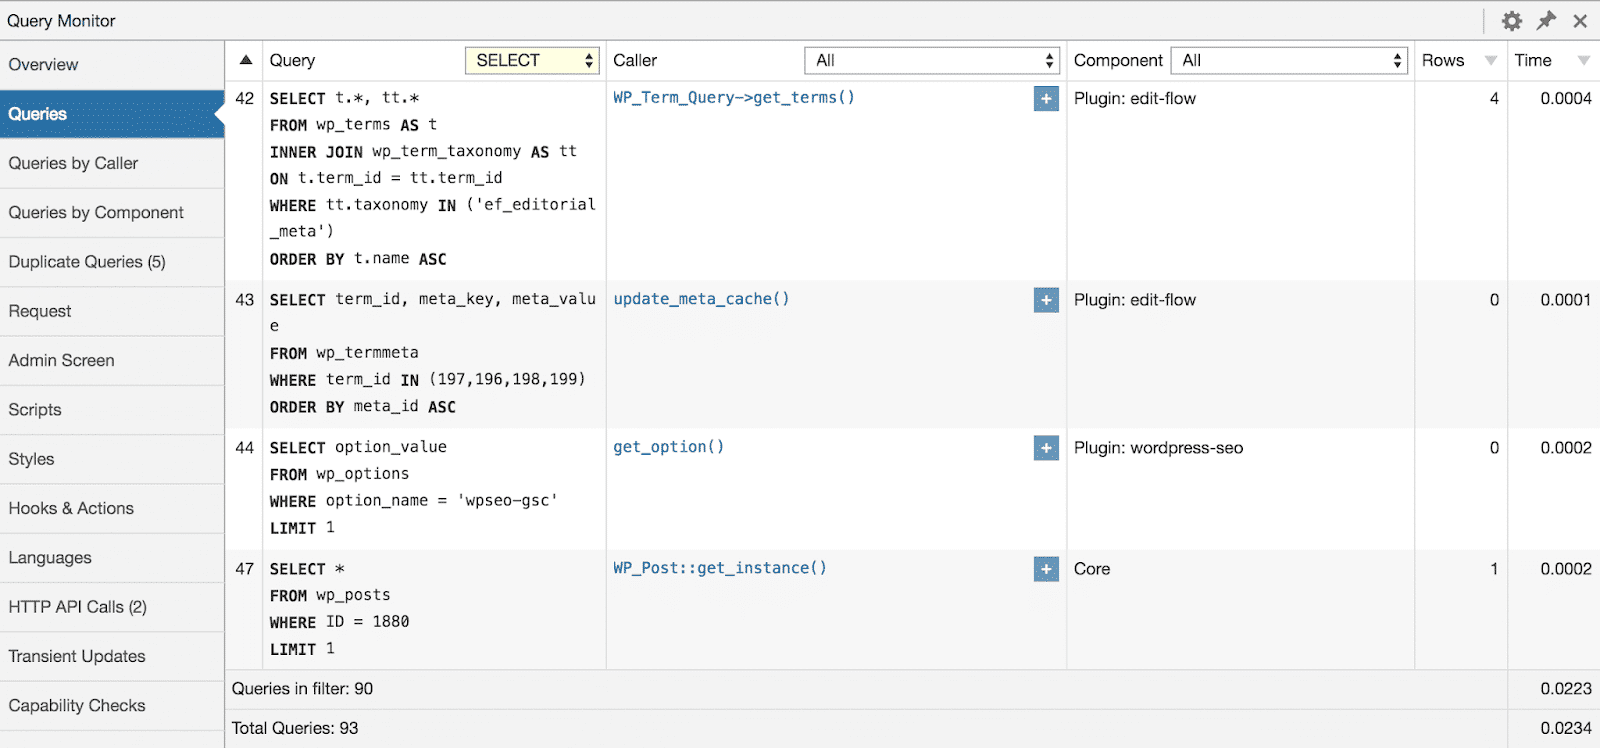
The most comprehensive plugin to gather and review information about current page load.
Query Monitor adds the entry to the WordPress toolbar of a site. Its menu gives access to all information about what happened in current page load.
The plugin notes and records everything from database queries to user capability checks. Often it would notice and highlight errors or things that might be.
Its data–heavy approach is apt to help develop and troubleshoot errors.
Laps
This plugin integrates with the toolbar as well but focuses on the presentation of results. Rather than an extensive list of data, it graphs a visual and intuitive picture of page load.
The total length of the graph corresponds to the total time of page generation. The longer things are on the graph the more time they took.
Laps marks and color codes various parts of page load. It pays special attention to boot performance (PHP, core, plugins, and themes load).
Its visual approach is apt to help notice heavy operations, slowing down the whole page. These are often slow SQL queries and network requests to other sites.
Start With Profiling
Profiler plugins are easy to install and provide insight into the performance of a site. They help make performance decisions, such as which plugin or theme to use. Before you start deactivating plugins or installing cache plugins on a site, take a minute to find out what problem you are solving, profiling plugins make it easy.
Such tools are useful to developers, site owners, and builders of all experience levels. For professionals, they are a constant indicator of site health and speed. For novices, they are an important educational tool on how WordPress site functions.


One thought on “Tools You Need To Find Out What’s Slowing Down Your WordPress”